Friday, January 27
Today we will discuss the use of prepositions with graphs!
Grammar tips

|
Today we will discuss the use of prepositions with graphs!
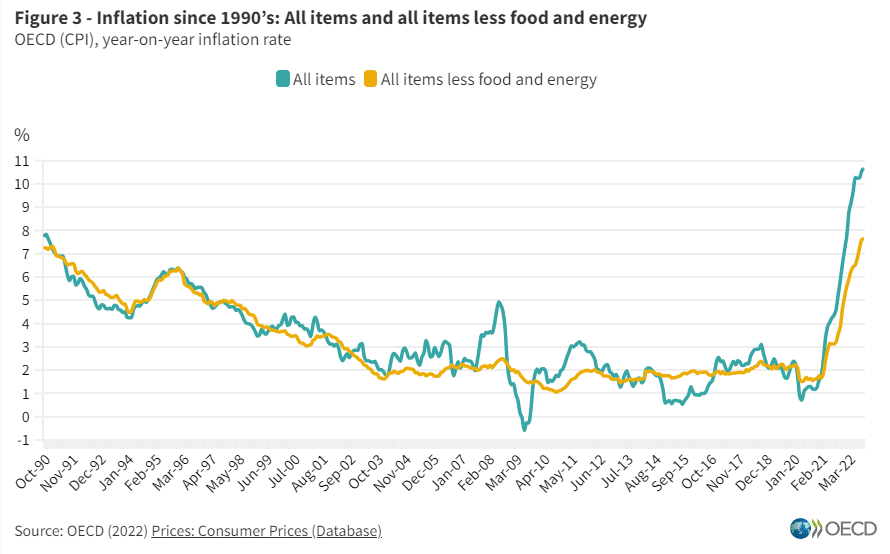
Take a look at this graph:
|
According to the graph, we must use different prepositions to transmit specific information:
- “The overall prices of all items rose by 10% as compared to 2020.”
- When using a verb followed by the amount of change, use by.
- “The prices of all items less food and energy rose to approximately 8% in 2022.”
- When using a verb followed by the upper/lower limit, use to.
* Note: When using a verb followed by the amount that is both the amount of change and the upper/lower limit, the preposition is optional: to or by.
Now let's change the reasoning a little bit. Take a look at the following sentences:
- “There was a rise of 50%.”
- When using the noun form followed by a numerical value, use of.
- “There was a rise in food and energy prices.”
- When using the noun form followed by a concept, use in.
You can also use both: “There was a rise of 50% in food prices.”
Finally, the contrast of the prepositions by and to can occur in situations such as the following:
- “The oil prices dropped by US$30.00 a barrel.”
- The price change was of $30.00 (ex. from $70.00 to $40.00).
- “The oil prices dropped to US$30.00 a barrel.”
- The price dropped to the level of $30.00. The difference here is variable.